When researching the term Smart Grid it is apparent there is not one coherent definition. It seems Smart Grid describes a concept in a variety of ways, and is often compared to the Internet in potential pervasiveness and usefulness. However, the Internet has a distinctive description and a foundation in the definition of the TCP/IP protocol. NIST has taken on the challenge to coordinate the effort of defining interoperability standards analog to a TCP/IP stack, and a cornerstone definition is the GWAC 8 stack.
One observation can be made that energy consumers in their own are getting very sophisticated and energy optimized, however, from a utility view, these attributes are not accessible. The opportunity, Smart Energy Consumers need to be enabled to connect to the utility. Bridging the communication gap between Utilities and Energy Consumers seems paramount. Enabling limited load controls by the utility has potentially substantial benefits. For example it would allow limited load shedding which is probably a key feature to make the grid more effective.
The aggressive build out of Renewable Energy Sources will potentially challenge the current grid operations significantly. There will be needs to balance load and generation as they are typically not matched. The location of generation and consumption can be in very different parts of the grid too. Balancing of base load generation by coal, oil and nuclear with Wind, Solar and Biomass will be needed as it challenges the current ecosystem. Possibly new financial models for utilities will emerge. It is quiet possible that Green Energy will be more valuable than traditional Energy, therefore the access to Green Energy will be a key driver.
There are many open issues and an industry acceptable implementation has to be developed. This needs a lot of definitions, research; knowledge will be generated in collaboration and needs to be distributed. The most exiting part is the journey we are on today, This is the time to be active, be part of it to form the future of our grid.
Monday, February 1, 2010
Monday, January 25, 2010
How do Server Virtualization, CPU Utilization and IT Utilization Efficiency relate
When talking about virtualization in a Data Center and how it effects CPU utilization and Efficiencies I find myself often in a debate about definitions and not getting to the substance… So I thought it might be helpful to define some simple terms and formulas here. I promise its simple math.
On the server level, this measure of how many virtual servers are hosted on one physical server is commonly used:
# Virtual servers on one physical server (SVP);
keep in mind, that server is no longer available as a stand alone server
On the data center level:
These terms are typically used:
# Total available Servers in Data Center (ST)
# Physical Servers hosting Virtual Servers as a subset of # physical servers (PSV)
# Virtual Servers in Data Center (SV = PSV*SVP)
# Physical Servers in Data Center (SP = ST + PSV – SV)
% Virtualization Degree in Data Center (VDDC = SV/ST)
As an illustration, assuming a Data Center has the need of 1000 total servers, dependent on the virtualization choices (yellow fields) results in a significant difference in how many physical servers are needed (and generate Green House Gas Emissions).
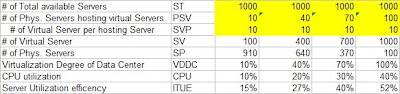 There are two more items to consider the CPU utilization and Server Utilization Efficiency. You can read more on those here, simplistically they describe how busy the server is (CPU) and how efficient it is able to convert electricity into IT work.
Typically servers with no virtualization have a CPU utilization of 10% or less, pretty low. With virtualization this can be increased and a 40% utilization is desirable. I assumed that 10 virtual servers on one physical server gets you to 40% CPU utilization, but that might be different in your data center depending on your servers and applications.
On the server level, this measure of how many virtual servers are hosted on one physical server is commonly used:
# Virtual servers on one physical server (SVP);
keep in mind, that server is no longer available as a stand alone server
On the data center level:
These terms are typically used:
# Total available Servers in Data Center (ST)
# Physical Servers hosting Virtual Servers as a subset of # physical servers (PSV)
# Virtual Servers in Data Center (SV = PSV*SVP)
# Physical Servers in Data Center (SP = ST + PSV – SV)
% Virtualization Degree in Data Center (VDDC = SV/ST)
As an illustration, assuming a Data Center has the need of 1000 total servers, dependent on the virtualization choices (yellow fields) results in a significant difference in how many physical servers are needed (and generate Green House Gas Emissions).
There are two more items to consider the CPU utilization and Server Utilization Efficiency. You can read more on those here, simplistically they describe how busy the server is (CPU) and how efficient it is able to convert electricity into IT work.Typically servers with no virtualization have a CPU utilization of 10% or less, pretty low. With virtualization this can be increased and a 40% utilization is desirable. I assumed that 10 virtual servers on one physical server gets you to 40% CPU utilization, but that might be different in your data center depending on your servers and applications.
In the table above I made the assumption we start CPU utilization at 10% in average across all servers and as we implement more virtualization in average we get to 40%, proportional to VDDC increasing. With that the servers get significantly more efficient and ITUE grows in average to 52%. These are general examples and your environment may be very different.
Purpose was to give you a quick framework on how all these values and definitions work with each other. Hope this is helpful.
Wednesday, January 20, 2010
Always wondered what Data Centers and Swimming Pools have in common?
When asked to describe how the airflow should work best in a raised floor data center the best analogy I am able to come up with is a swimming pool. Bear with me…
In today’s Data Centers the rows of server racks are frequently arranged in a hot aisle cold aisle system, if not, they should. For non Data Center folks see at the end for a quick explanation what that is. Cold air comes from the bottom and likes to stay low. It’s like water in a pool. Incoming air needs to match or being slightly oversupplied to the air used through the servers. That’s like returnflow perforations in a pool. But to get the cold air all the way up to the edge of the racks the cold aisle cannot have big leaks. Biggest leaks are:
- the front and back entrance of the aisle
- voids of racks in the aisle due to building columns, etc.
- openings in the racks, unused U’s without blanking panels.
- voids in the racks between mounting rail and side panel
What is not a leak is the top, as long as air supply is matched and like in a pool with a little overflow. In fact that overflow can be used for closed loop control of air supply. One way to achieve balanced airflow is to fill aisles sequentially until the server air intake matches the supply capacity. Vent shutters can help to reduce flow where needed.
So if all voids are closed the air will fill the cold aisle like water in a swimming pool. As simple as that. Next time you walk into the Data Center just have that visual in mind.
There are simple ways to get these leaks closed, fire proof “meat locker drapery” for the ends of the aisle, or a simple door as an example… doesn’t have to be complicated, as long as it meets your fire code. And having an open top of the row helps you with that.
Using the rest of the building as the hot aisle has a nice savings effect too. In most parts of the world it’s rare that outside temperatures are hotter than the exhaust of the servers, therefore what used to be side load for the air-conditioner is now free cooling for most of the year.
Now voids in the racks between mounting rails and side panel are also a thermal short circuit in the rack, amplified by the doors. The fans in the servers will create with the perforation of the front door suction and the with the back door perforation pressure. So instead of all server air coming in and out the doors, the pressure differential will drive circulating air within the rack. Easy test, try to get your hand between the mounting rail and the side panel, if you can, you have a problem.
Why is this all important? Inside Air-conditioning equipment has simplistically three variables describing its ability of removing heat (assuming fixed flow of coolant or compressor capacity):
- effective length/surface of coils (typically fixed)
- air flow (can be adjusted to a certain degree)
- temperature differential
Another important factor determining the efficiency is the temperature the cooling coil has to operate, warmer is better.
Without separating the cold and hot air the temperature differential between hot and cold air is not really high, a lot of back mixing happens. As a consequence it isn’t uncommon that the factory rating of air-conditioning equipment isn’t attainable because the warm air isn’t warm enough for the unit to extract the amount of heat it was rated for. Sometimes only a fraction of the recommended rated temperature differential is achieved across the coils resulting in similar loss of capacity. Ironically the Servers generate a very significant temperature differential and would make the air-conditioning coils very effective, but because the hot and cold air back mix in the room, it’s lost.
If cold air is prevented from mixing with the hot air, automatically a higher coil temperature differential can be achieved. That’s it. It gets you more cooling rating into your Data Center (which you thought you already had and paid for!) and lowers your electricity bill. It’s impossible to give a universal number of improvements, but I wouldn’t be surprised to see several percent points, even low double digit dependent from where you start.
Hot Aisle Cold Aisle:
In the cold aisle all servers have their front facing the aisle. If you walk through the cold aisle looking left and right you see the front panels of the servers. That is where the servers pull in their cooling air, therefore that is where the cold air supply is routed in. Conversely the back end of the servers face the hot aisle, that is where the air exits the servers taking the heat out of them. That is where the hot air is collected to go back to the air-conditioner. Why is this done? If the Servers would be arranged front/back front/back, the hot air from one server would blow into the front of the next server.
Wednesday, December 9, 2009
Efficient Enterprise: Making a Successful Transition to a Green IT Infrastructure
Adopting a green IT infrastructure is the key to sustainable growth, and in today’s economic climate can often be the difference between simply surviving and flourishing. CIOs can accelerate this transition by cost-justifying strategic IT investments that advance enterprise efficiency while helping to simplify management and reduce operational costs—thereby contributing to a healthy bottom line and a healthy environment.
Read more at
http://www.dell.com/downloads/global/power/ps4q09-20100174-Green.pdf
Read more at
http://www.dell.com/downloads/global/power/ps4q09-20100174-Green.pdf
Sunday, October 25, 2009
Smart Grid Challenges and Opportunities
When researching the term Smart Grid it is apparent there is not one coherent definition. It seems the term Smart Grid describes a concept in a variety of ways, and is often compared to the Internet in potential pervasiveness and usefulness. However the Internet has a distinctive description and a foundation in the definition of the TCP/IP protocol. NIST has taken on the challenge to coordinate the effort of defining Grid interoperability standards analogue to a TCP/IP stack, and a cornerstone definition is the GWAC 8 stack.
One observation can be made that energy consumers in their own are getting very sophisticated and energy optimized, however, from a utility view, these attributes are not accessible. One conclusion can be that Smart Energy Consumers need to be enabled to connect to the utility. Bridging the communication gap between Utilities and Energy Consumers seems paramount. Enabling limited load controls by the utility has potentially substantial benefits. For example it would allow controlled, limited load shedding which is probably a key feature to make the grid more effective.
The aggressive build out of Renewable Energy Sources will potentially challenge the current grid operations significantly. There will be needs to balance load and generation as they are typically not matched. The location of generation and consumption can be in very different parts of the grid too. Balancing of base load generation by coal, oil and nuclear with Wind, Solar and Biomass will be needed as it challenges the current ecosystem. Possibly new financial models for utilities will emerge. It is quiet possible that Green Energy will be more valuable than traditional Energy, therefore the access to Green Energy will be a key driver.
There are many open issues and an industry acceptable implementation has to be developed. This needs a lot of definitions, research; knowledge will be generated in collaboration and needs to be distributed. The most exiting part is the journey we are on today. This is the time to be active, be part of it to form the future of our grid.
Sunday, September 6, 2009
Clean IT
Green IT is becoming Clean IT...
As I look at the evolution of Green IT, it occurred to me, it is much more transformational than one would have ever guessed. I think there are three buckets typically one could sort Green IT activities into:
- reduction of waste, packaging materials, hazardous materials and such in production, operations and facilities
- holding your vendors to the same Environmental standards as you are (vendor management)
- reduction of Green House Gas (GHG) emissions which is synonymous for Energy savings
The last bullet, GHG reduction, is really interesting, it evolved. At first it was all about upgrading your IT facilities, specifically Air Conditioning and Power Delivery equipment. Then the efficiency of Server Power Supplies was added. Realizing that the majority of IT equipment of an average Enterprise is outside of the Data Center, client compute equipment (specifically desktop PC's and CRT's) got in focus of power supply improvements early on with the first version of E-Star in 1992.
But the power consumption of IT wasn't going down, the ever increasing exponential IT demand used up the improvements and upgrades rather quickly. IT demand seems to have a constant growth rate, a characteristic of an exponential function. The issue with exponential growth is, if you don't know you are on it, it can really surprise you. The initial growth looks slow, after 2/3 of the planned time only 1/3 of the resources are used, so you could think you have plenty to go... But then things start to go really fast, the last 2/3 of resources are getting used up in the remaining 1/3 of the planned time, you could think you are running into a wall with light speed... Sounds familiar?
Data Centers still were filling up, Client equipment still was on and idling over night. A recognition set in that the utilization of IT assets was very low and lead to unnecessary consumption of energy, hence unnecessary emissions of GHG's. But this is only the tip of the iceberg when it comes to cost, IT continues to use an enormous amount of Capital and has significant operational cost associated to manage this exponential growth.
At that point the focus of Green IT became how to optimize the operations of IT to be more efficient. Things like managing client equipment remotely with tools allowing to enforce Power management and shutdown at night; using virtualization, thin provisioning on storage and such to increase the utilization of IT assets in the Data Center. Aside from the Energy savings a reduction in complexity and associated costs are observed.
With better policies around IT utilization in place (or getting in place), the next improvement was possible, bringing Moore's law into the Physical IT world, e.g. Data Centers and Offices. Moore's law is an exponential function by itself, and with the right policies on refresh and utilization of IT equipment it can offset the exponential IT demand growth. For Data Centers, that requires a rethinking of how they are used and build, but also has the promise of no more additional power and space needed. With that, no more additional GHG's. And a significant reduction in cost all around. Most Data Centers today are not built and operated with that in mind.
What Green IT drives now is an industrialization of IT operations, it is a cleaner way in all respects to run IT with less pollution, less complexity, less use of resources, less expensive.
Green IT is becoming Clean IT!
Friday, August 21, 2009
Wind turbines as far as the eye can see
You don’t believe me, right? Well, in Texas everything is bigger, so they say. And for Wind Energy, absolutely. Driving to Lubbock, TX from Austin, TX is quite an experience. Making the journey at night is even better. When you hit I-20 east of Abilene, TX you start to see some red lights in the dark sky, here and there in small clusters. You could think these are antennae or cell towers. As you make it through Sweetwater, TX and turn onto US-84 you get reminded of some Sci-Fi movies. As far as the eye can see red synchronize blinking lights in the dark sky, hundreds. It is surreal, never have I seen anything like it. To further my confusion once in a while an overwhelming smell came through the A/C. As I drove the first time I had no idea what all of this was, until next morning. Wind turbine installations on every rim and ledge and high plain for optimized wind capturing. And in between oil and gas wells (that's the smell), cotton farms and room for solar. The wind and sun are there plenty, and transmission lines for the wind energy too (though need to be more). Wind blows on the edges of the day typically, so solar energy can use during the midday the same transmission lines with really no congestion… Driving to Lubbock and its Texas Tech University made it clear to me:
Texas, the Sustainable Energy State.
Texas is oil, yes and it has build up a true global technology leadership all around it. Texas is Wind, and it is Solar. Texas is bio mass. Texas is marine and land based technologies, and has hydro along the Colorado River. And it is building up technology leadership all around these areas too.
Texas is Energy, sustainable.
What a place to be in today’s times, it’s all here, great technology with it’s leading Universities, Energy and High Tech companies and entrepreneurs, a unique infrastructure as Texas has its own electric grid (ERCOT); some of the best places nature has for all of these energy forms; and its people. If y’all not from Texas, look up the amazing history of the Alamo, that will explain it. And as they say, it all comes Texas sized! Don’t believe me? Today Texas has approximately 1/3 of the US wind generation (8/24/09: OK I rounded up, it's 28.4% according to http://www.awea.org/projects).
Subscribe to:
Posts (Atom)